Different levels of detail and precision differentiate the estimation methods
Estimation methods for time and cost grow in complexity and detail as the Project gets better defined. We start with a rough estimation and evolve until we have an estimate for every single task of the WBS.
This is simples method that uses a simple proportion to have a rough estimate: Example: to build a 3-floor buidling, it took us 12 months and U$ 15 million, to build a building with 4 floors, we will need 16 months and U$ 20 million.
To do parametric estimation, first start by identifying the dimensions that affect price, eg. area, luxury level, location, etc… and build a statictical model to get the estimate.
For example. Parametric estimation requires more data to estimate: you consider some buildings’ cost to build and observe the area, the level of the work (upscale or simple), cost of building around, etc… all these are parameters that you can use in a regression analysis to infer the cost of the project.
In a regression using model Y = a X0 + b X1 + epsilon, where Y is the cost of the building, X0 is the constructed area and X1 is the quality level of the construction (1 for luxury, 0 for basic) and epsilon is there to capture all the other unobserved parameters. As you refine the model, epsilon should evolve towards zero so your trust in the model increases. The parameters a and b are the output of the regression and they represent the contribution of each of these dimensions to explain the final cost.
This method is the most rigorous and can be applied to every activity in the WBS to get the very best estimate for the overall project.
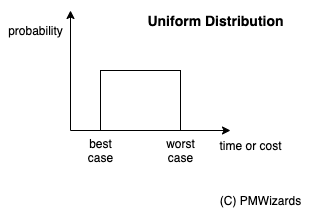
Start with a 2 point estimation for the best, worst cases and add a third pints to represent the most probable case. These 3 points provide a probabilities distribution.
A uniform distribution constructed from a two point estimates, best and worst cases. Note that all values in the range have the same probability, what is not what actually happens: people either frontload work or do at the last minute (As Late As Possible) so that we need a third point to show how skewed is the distribution.
A three proints estimation allows for different distributions: biased left, symmetrical and biased right as indicated in the following diagram.
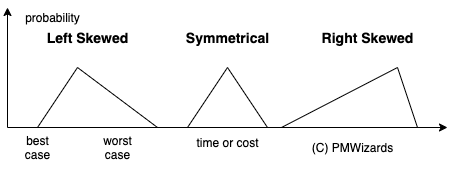
There are different possilbe distributions, such as Beta, Triangular or PERT and the ubiquitous symmetrical distribution known as the Normal (“Bell curve”) distribution.